Denali and the Alaska Range: Mapping North America’s Highest Peak
Brooke E. Marston | U.S. Department of State, Washington, DC, USA
Key words: Denali, shaded relief, panorama, plan oblique, relief representation
1. Introduction
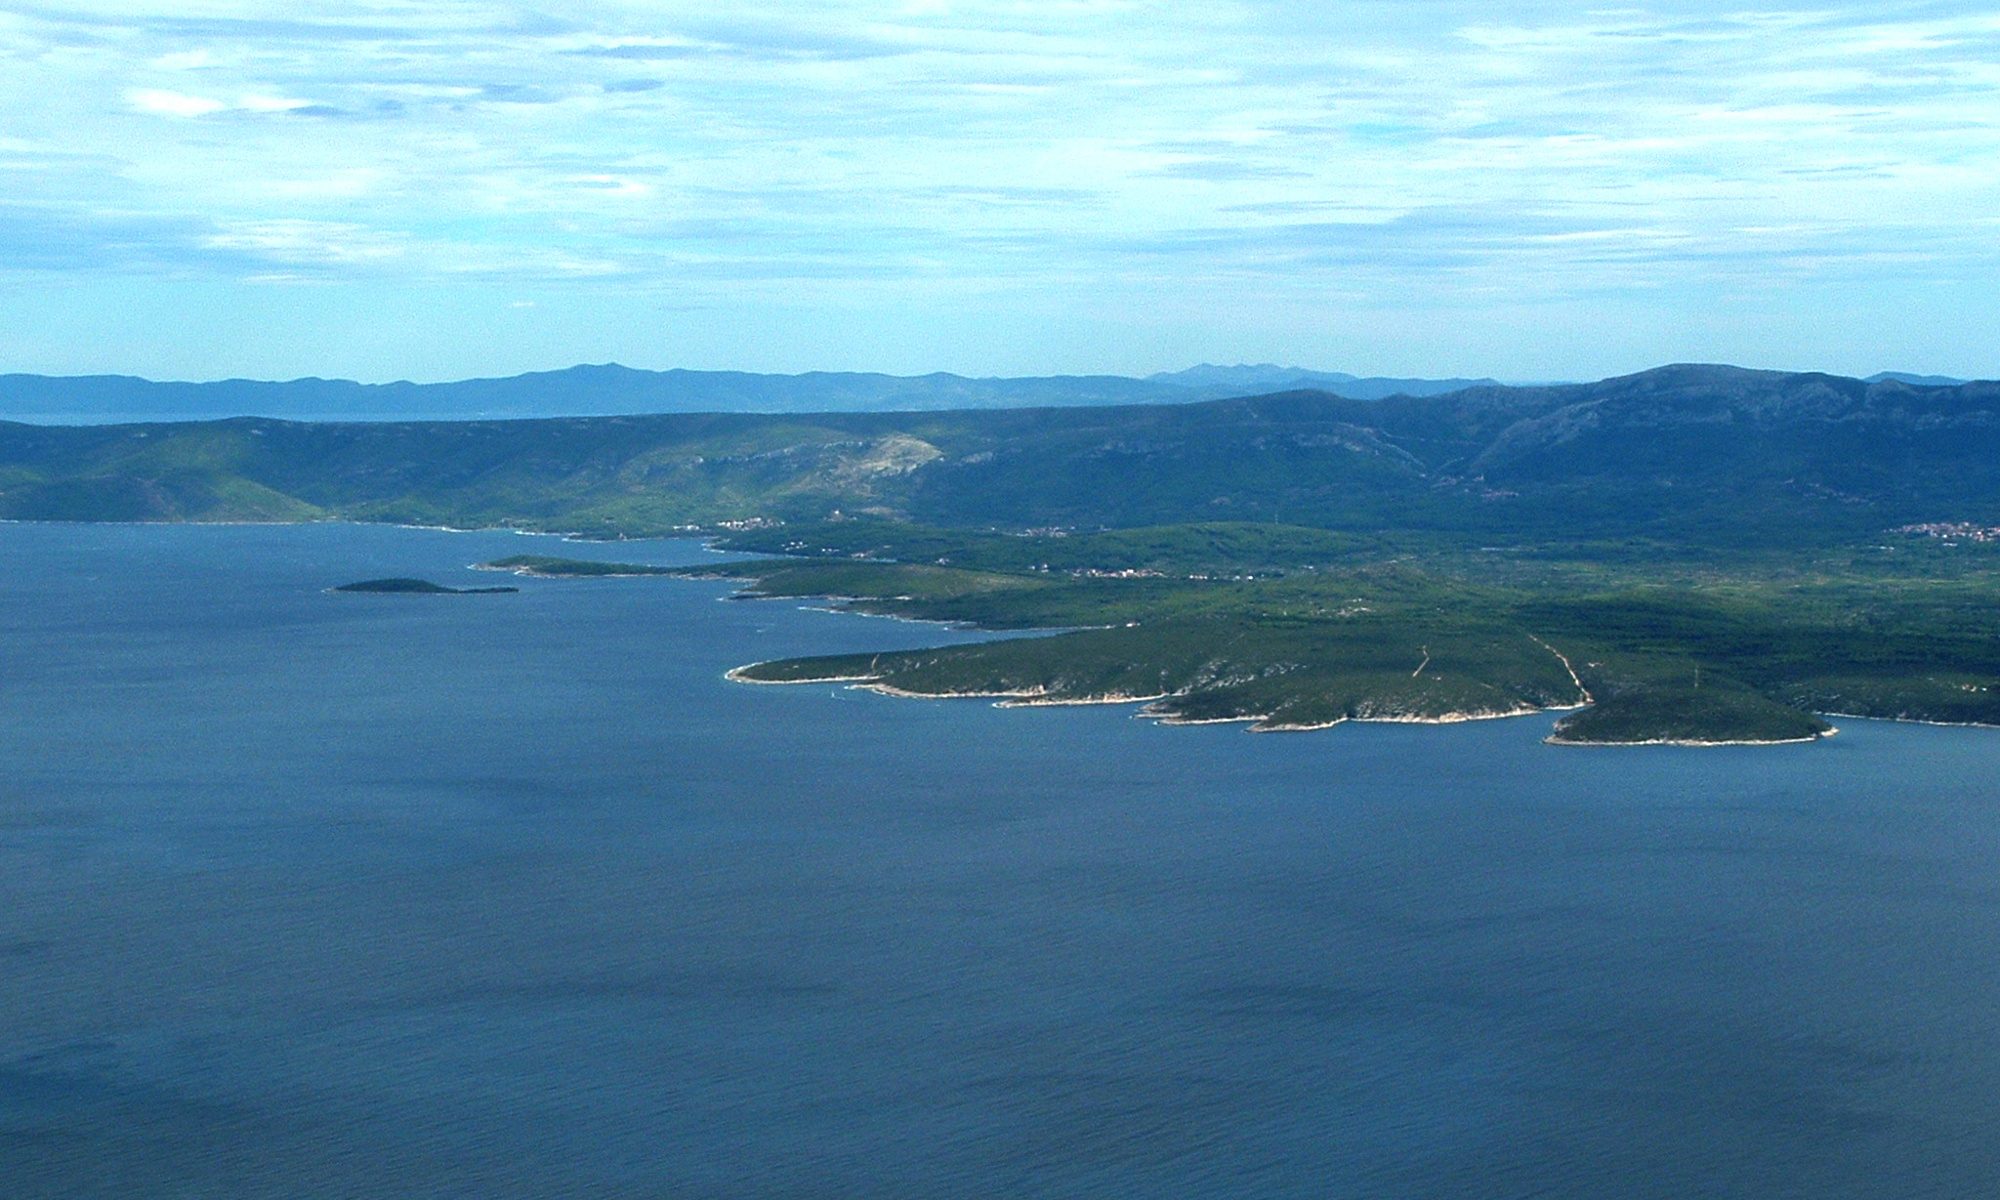
Denali, one of the world’s most prominent and isolated peaks, is part of the narrow, 650-kilometer long Alaska Range stretching from southcentral Alaska to the border of Canada’s Yukon Territory in the southeast. The vast and mountainous terrain poses a unique cartographic challenge. This paper
examines the motivation, challenges, innovative cartographic techniques, and design decisions behind the panoramic map of Denali and the Alaska Range (Figure 1).
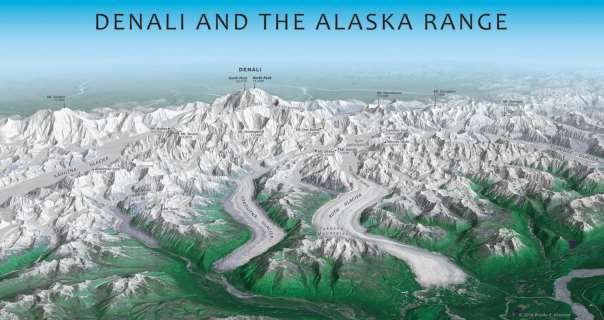
Figure 1: Denali and the Alaska Range (Marston, 2016).
This panoramic map of Denali was inspired by renowned Austrian painter and panoramist Heinrich Berann. Berann skillfully blended artistic ingenuity with natural realism to invite the viewer to experience a landscape in a more visceral manner. Denali, meaning “the great one,” was Berann’s final
panorama (Figure 2). Since its publication in 1994, panoramic maps of Denali have been scarce.
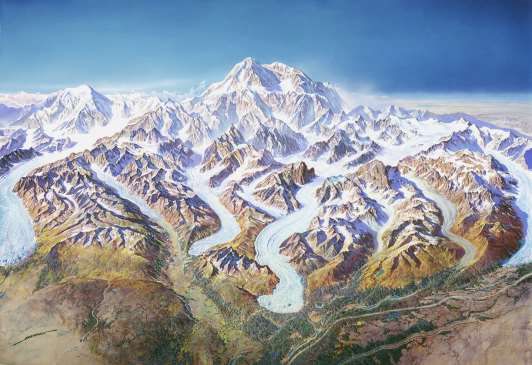
Figure 2: Denali panoramic map by Heinrich Berann in 1994 (Patterson, 2000).
The map was motivated by a passion for relief representation and desire to test the limits of perspective, orientation, and vertical exaggeration in a topographically complex alpine landscape. The recent renaming of North America’s highest peak from Mt. McKinley back to its Alaska Native name
also served as inspiration for this map, one of the few panoramic maps of Denali produced in more than two decades.
2. Cartographic Methods and Production
The rugged expansiveness of the Alaska Range is difficult to illustrate comprehensively with standard two-dimensional planimetric mapping techniques. Using an oblique three-dimensional perspective captures the grandness of Denali and the Alaska Range in one continuous view. The bird’seye-view emphasizes the sheer size of the mountains while maintaining a closeness with the viewer. The map incorporates aspects of Berann’s distinct style with natural-color images derived from highresolution
imagery draped over a plan oblique rendered shaded relief.
Because weather in Alaska is highly variable and unpredictable, finding high-resolution satellite imagery with minimal cloud cover was a challenge. Landsat 8 30-meter resolution satellite imagery from June 2015 was downloaded from Libra, a browser for open Landsat 8 satellite imagery (Libra, 2015). A composite RGB image was created by merging Landsat 8 bands 4, 3, and 2 as RGB channels in Adobe Photoshop CS6. To enhance the green hue for forests, a second composite RGB image–created by merging Landsat 8 bands 7, 5, and 3–was blended with the 4-3-2 composite RGB image. Panchromatic sharpening was used to increase resolution. Curves and blending modes of the composite layers were adjusted in Photoshop to approximate Earth’s natural colors (Patterson, 2015).
Natural Scene Designer Pro 6.0 was used to render a three-dimensional plan oblique terrain model from a 5-meter digital elevation model. Once an appropriate viewpoint position was selected, the satellite imagery was draped over the terrain model and a panorama TIFF image was rendered. A
distance mask–a grayscale image in which the shade of gray is based on the distance from the camera-was also rendered. The panorama TIFF was modified in Photoshop with various adjustments to apply selective coloring and illumination. The distance mask TIFF was used to fade and blend the
background of the map with the sky. Adobe Illustrator was used to add text and labels to the map.
3. Design
The panorama’s point of view was one of the most significant design decisions. A carefully selected southeastern viewpoint highlights the long and narrow Alaska Range as it arcs to the northwest. Denali is featured majestically in the center of the map with the range wrapping around and framing its peak. The Kahiltna, Tokostina, Ruth, and Eldridge Glaciers direct the viewer’s vision from lowlands in the foreground, up the span of the glaciers to their nexus at the base of Denali.
Berann took artistic license with the precise location and position of features when painting panoramas, often selectively rotating or rearranging mountains to avoid obstructing or obscuring certain features. However, this panoramic map depicts a more realistic landscape true to the geography. Except for a slight vertical exaggeration, major landscape features have not been altered.
Berann’s panorama, reminiscent of a landscape painting, utilized bright, saturated colors. To achieve a similar effect, bright green vegetation was used in the lowlands to reflect spring tones. Highelevation peaks were rendered in soft grays, whites, and blues, evoking a wintery chill. The striking contrast between these color palettes and the bird’s-eye-view perspective transports the viewer into the jagged, cold, majestic landscape. The Denali panorama portrays the massive scale and grandeur of this dramatic wilderness from the perspective of a soaring bald eagle.
4. Conclusion
Creating the Denali and the Alaska Range panoramic map tested the advantages and limitations of perspective, orientation, and vertical exaggeration in a unique landscape. The map, although not as beautiful as Berann’s meticulously hand-painted masterpiece, has been well-received by the cartographic community and beyond. Today’s 3D relief rendering software applications have made producing plan oblique maps faster, less expensive, and more accessible; however, not all landscapes benefit from a panoramic depiction and it should be used judiciously. Although new technology
lessens the requirement that a cartographer possess specialized manual artistic skills, the success of a panoramic map continues to rely heavily on the design decisions made by the cartographer. As cartography evolves in new directions, Heinrich Berann’s panoramas serve as inspiration and a guiding
force forward in the digital age of 3D relief representation.
Acknowledgements:
The author thanks Tom Patterson for providing expert feedback on how to take a well-designed map and make it something truly exceptional.
References
Libra, 2015, Developed by Development Seed and Astro Digital, Website:
https://libra.developmentseed.org/ (accessed August 20, 2015).
Marston, B, 2016, Denali and the Alaska Range, map in Atlas of Design, v. III, North American Cartographic and Information Society, Milwaukee, WI.
Patterson, T, 2000, A View from on High: Heinrich Berann’s Panoramas and Landscape Visualization Techniques for the U.S. National Park Service, Cartographic Perspectives, 36.
Patterson, T, date unknown, Landsat 8 Photoshop Tutorial, Website:
http://www.shadedrelief.com/landsat8/introduction.html (accessed August 24, 2015