Mapping the mountains and glaciers of South Georgia
Laura Gerrish | British Antarctic Survey, UK
Keywords: South Georgia, map production, topographic mapping, glacier change, digital elevation model, rock extraction
South Georgia is a British Overseas Territory lying 1300 km southeast of the Falkland Islands in the South Atlantic. The island is approximately 170 km long, between 2 and 40 km wide and has an area of 3755 km2, more than half of which is permanently ice covered. Its highest peak is Mt Paget at 2934 m. South Georgia is globally significant due to the large populations of seabirds and marine mammals, including the wandering albatross, and it is home to one of the longest and most detailed scientific datasets in the Southern Ocean. It has a varied history including a large whaling and sealing industry in the 20th century, with seven disused whaling stations still present on the island today, and it is famous for the epic crossing of Shackleton and his crew in 1916. Increased tourism and scientific activity today provide drivers for environmental management and the need for accurate and up-to-date
mapping is clear, for these reasons and many others.
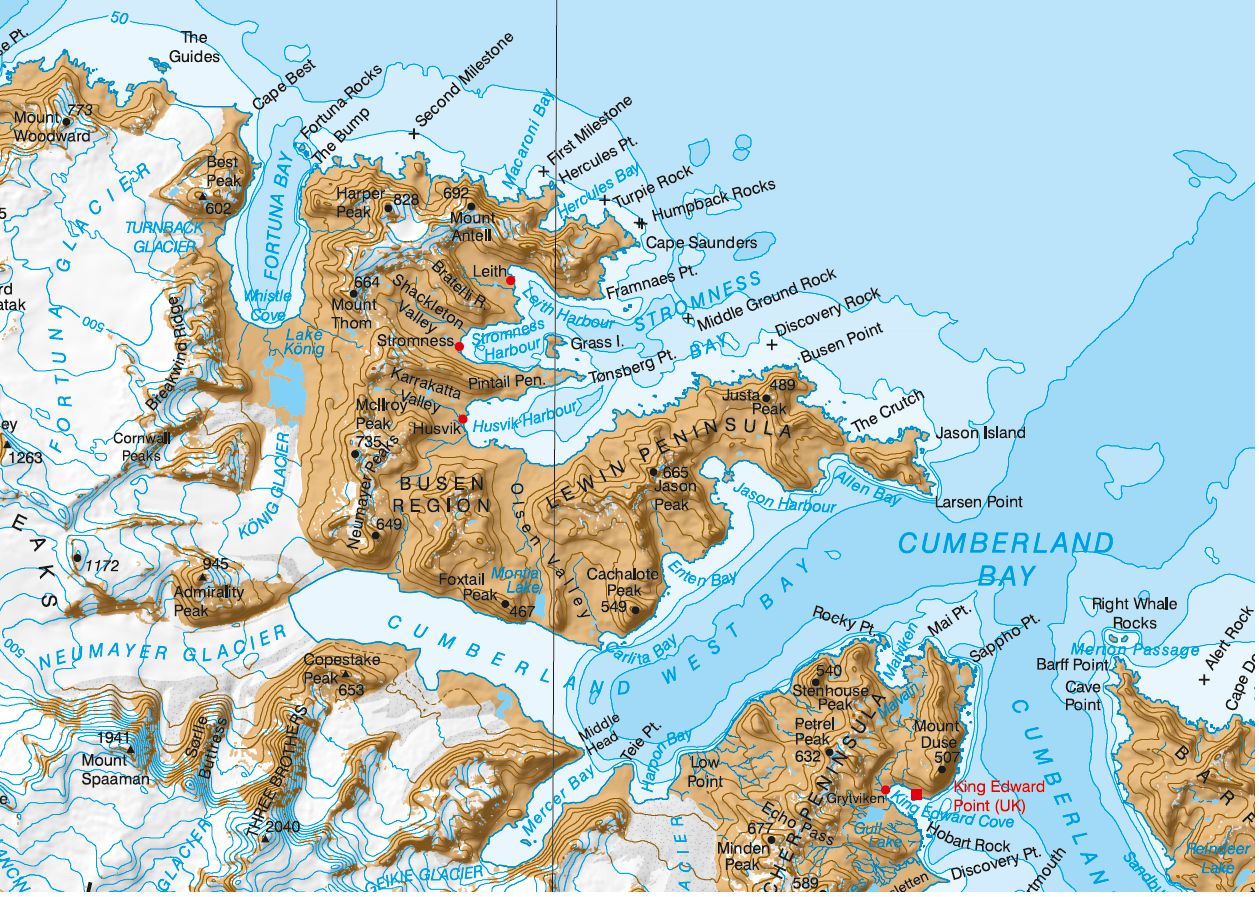
The first complete map of the island, produced in the 1950s, was based on triangulation surveys and overland mountaineering travel. Mapping the island has its own unique challenges due largely to the remote, mountainous landscape and limited data availability. British Antarctic Survey has two bases on South Georgia and first published a topographic map of the island in 2004. Since then, the landscape has changed considerably, with Neumayer Glacier for example retreating 6 km since 2004. In 2017, an updated topographic map was produced at 1:200,000 scale, which required extensive work to acquire better data and to present it in an eye-catching and informative map. There was also a need for a good map of a popular hiking route crossing South Georgia following in the footsteps of Ernest Shackleton in 1916, and it was decided to produce a high-resolution map on the reverse side.
The data for the main map were produced largely from Landsat 8 and Sentinel-2 satellite images, with a cloud-free Landsat 8 image of almost the whole island from February 2016 proving invaluable. This was used to automatically extract rock and moraine areas using the method of Burton-Johnson et al. (2016). Lakes and vegetation were also extracted from this image. Using this method to automatically distinguish between rock and ice was time saving and could prove very useful in further glaciated mountainous locations.
A new Digital Elevation Model (DEM) was required for the island to provide a hillshade and contours for the map. This was created from merging multiple DEMs together; five DEMs created from very high resolution (VHR) imagery were used where available and ASTER GDEM and SRTM data were used elsewhere. This created problems with differences in the acquisition date of the data as some glaciers had dropped in elevation by >100 m, and buffers were used to be able to merge the DEMs without sudden drops in elevation. Many contours were also left dangling due to the retreat of glaciers, and approximate contours were drawn in using local knowledge of the landscape and its current state.
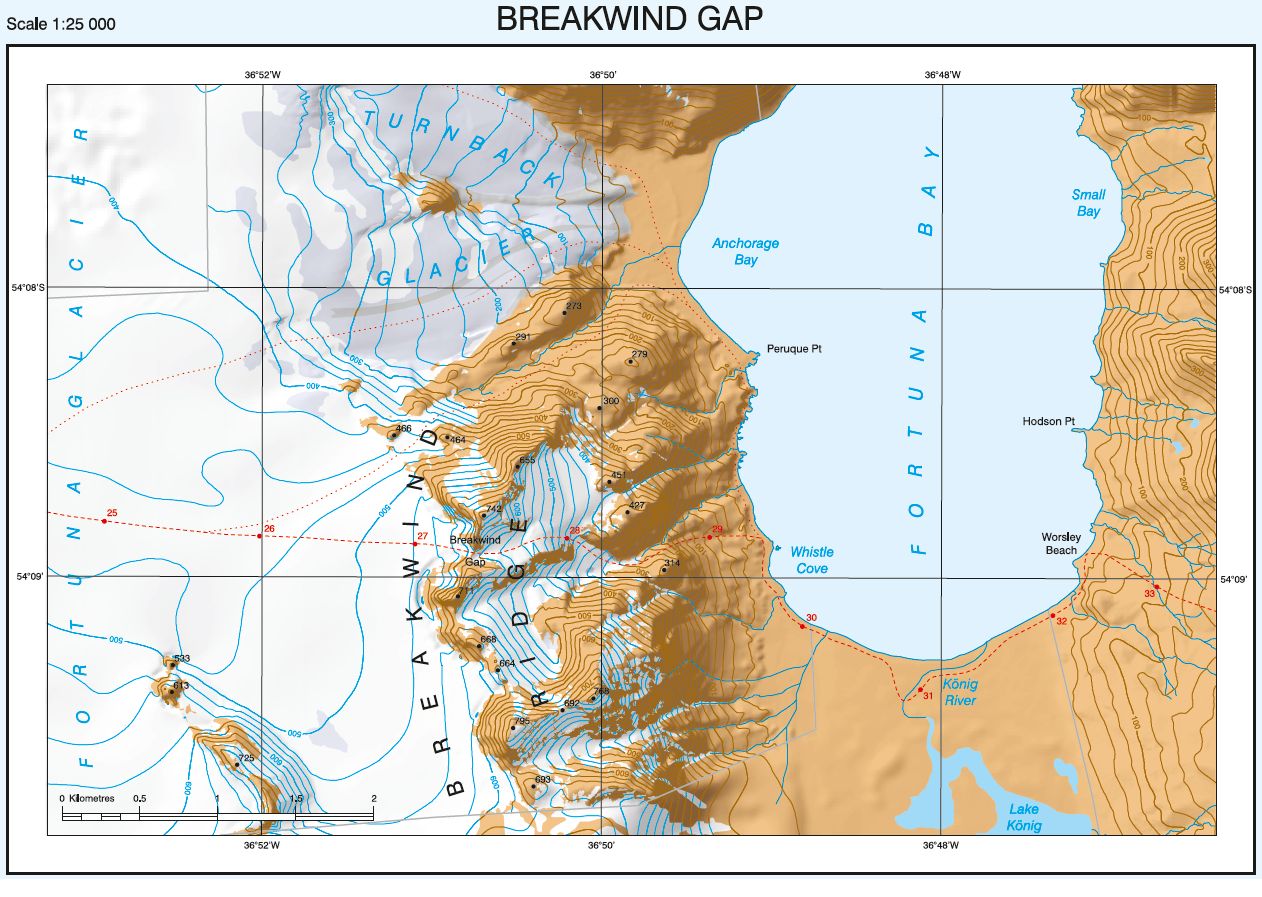
The reverse side of this map is a new 1:40,000 scale map of the Shackleton Crossing route, three 1:25 000 scale insets of key areas, a cross section of the main route and local mountaineering information. A DEM for the maps was created from a stereo-pair of VHR images, and features such as rock, moraine and blue-ice areas were digitised from the images.
As mentioned above, we encountered many cartographic and topographic problems when producing this map of South Georgia, mainly caused by the quickly evolving landscape and the remoteness of the island and these were overcome using a variety of techniques. The final product was printed on tough, waterproof paper and is already being used by scientists, explorers and tourists alike on South Georgia. The data produced for this map were added to the South Georgia GIS (www.sggis.gov.gs), an online GIS for viewing and downloading topographic, environmental and management information for South Georgia.
References:
Burton-Johnson, A., Black, M., Fretwell, P. and Kaluza-Gilbert, J. 2016. An automated methodology for differentiating rock from snow, clouds and sea in Antarctica from Landsat 8 imagery: a new rock outcrop map and area estimation for the entire Antarctic continent. The Cryosphere, 10(4), pp.1665-1677.
Two low resolution extracts from the map are attached, for interest.