Volcanoes and Mountains in the Deep Ocean –
The Challenge of Scientific Visualisation of Bathymetric Data
Nico Augustin | GEOMAR, Helmholtz Centre for Ocean Research Kiel, Germany
Key words: bathymetry, deep sea mapping, marine research, public outreach, marine geosciences
Introduction
For cartographers and scientist that work in subaerial regions, multiple datasets are nowadays available to create a meaningful map of high informative value and good graphical quality. High resolution elevation data, satellite images, vector data and much more is often publically available in
online repositories and can be downloaded within minutes. Also, high-resolution satellite, drone and aerial images with a good coverage of the target area can be acquired at relatively low costs. The mappers have plenty of data to work with and can, accordingly to their personal skills in mapping and
map design, often focus their creativity on the map, the target group and the product itself.
As maps from land are common in our daily use, the public that uses these maps (as print, in exhibitions or online) mostly has a good sense for the features they see on a map as long as it shows things they roughly know about. For example, on land or at the coastlines people will recognise
landscapes, vegetation colours, country and district borders, rivers, large and small cities and get a good feel about the distances and dimensions of the shown landforms and geographic features.
Quite the opposite is valid for maps and cartographers that work with deep-sea bathymetric data. The deep sea, far off the coasts and other oceanic areas with no direct economic use are not the focus of politics. Neither are the geomorphological structures and submarine landforms considered as
spectacular as, for example, photographs from the Moon, Mars and other planets and therefore submarine maps do not gain as much public attention. However, submarine maps are of great scientific value considering that the ocean covers about 70% of Earth’s surface. Both studies on geological
processes as well as any deep-sea research strongly depends of the quality and information provided by hydroacoustic mapping.
Bathymetrists in general suffer from low-resolution data (in most case cell-sizes of several kilometres), bad data quality (e.g. due to weather conditions, ship configurations, system failures etc.) and bad coverage (more than 80% of the ocean floor is unmapped with modern, high resolution techniques; GEBCO Seabed 2030 Roadmap). Also, the amount of data bathymetrists can work with is often limited to bathymetric data and the information of the acoustic backscatter signal that provides basic insights into seafloor characteristics. Additional data e.g., from seafloor sampling, seafloor observations with camera systems, sub-bottom profiles or even seismic data that are essential for the interpretation of bathymetric data are mostly missing or at least very sparse. Thus, scientists and seafloor-mappers are faced with the challenge of extracting the most out of the available data. As a result, bathymetric data far too often have been reduced to a simply gridded elevation model, published
in a rainbow color-code, leading to simple, tiny, non-understandable pictures that show the limits of a working area and/or to plot some sample locations, rather than that the maps are scientifically used.
Research and Results
Seeing the difficulties of data acquisition, post-processing and bathymetric map-making the marine scientific community sees more and more the need to make marine-sciences more visible to the public. The applications of marine maps are numerous as every marine research discipline needs maps as a
solid base for their science. Oceanographers need the ocean floor relief to model currents; biologists, petrologists and chemists need the data to find their samples, e.g. to define migration barriers or simply find the hard substrate many species need to settle; geologists need the data to understand how Earth works, for marine hazard and mineral resource assessments and much more. All of them are in need of reliable data and informative maps of the seafloor. The challenge of the modern bathymetrist is to provide these high-quality maps and prepare them in such a way that they can be used by non-specialist researchers and understood by the general public. Recently researchers start to see the need for meaningful, high quality bathymetric maps that not only serve a scientific task but also produce maps
that people feel comfortable to look at and explore the features a map is showing. The maps should also become more useful for public outreach, have some amount of beauty to attract people and give them a sense for the dimensions of Earth´s undersea features, by for instance making parallels to known land features (Figure 1). Many tools and techniques that are based on the knowledge of land cartographers can also be used for submarine mappers to a certain level but should be adapted to deal with limited data quality and amount (Figure 2). Several possibilities and ways to present bathymetric
maps to scientists, politics and the public in a meaningful and attractive manner as well as the effective scientific use of these maps will be discussed during the presentation.
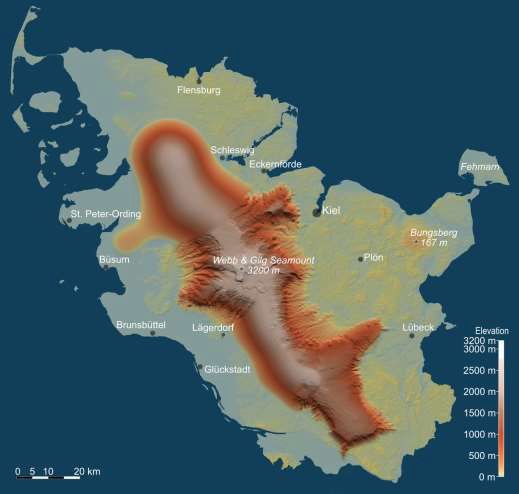
Figure 1: Visualization of a large submarine volcano (Webb & Gilg Seamount, Central Eastern Atlantic) that was mapped during a research cruise R/V Maria S. Merian, MSM70. This map was used for public outreach and the aim was to give the reader a sense of the dimensions of this structure as well as showing the huge gain in resolution by the ship-based seafloor mapping by comparing the detail-less low-resolution data with the highly-detailed mapped parts of the structure. The seamount data are overlain to land data of the German federal state of Schleswig-Holstein. The map was created by using Global Mapper, Photoshop (Geographic Imager Plugin), Affinity Designer.
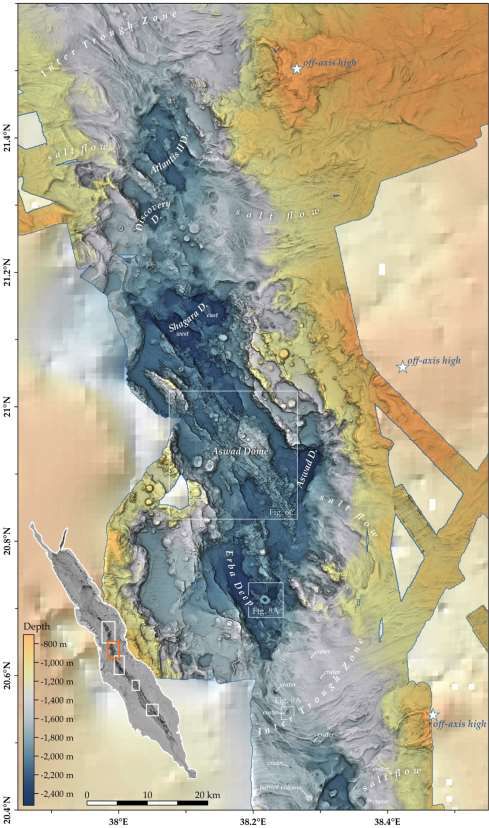
Figure 2: Scientific bathymetric map of volcanic terrain and submarine salt glaciers in the Red Sea Rift (Augustin et al., 2016). Data from research expeditions with R/V Poseidon and R/V Pelagia in 2011 and 2012, respectively. Map created with TTS-Shader, Global Mapper, Photoshop (Geographic Imager
Plugin), Surfer and Corel Draw.
References
Augustin N, van der Zwan FM, Devey CW, Ligi M, Kwasnitschka T, Feldens P, Bantan RA, Basaham AS, 2016, Geomorphology of the central Red Sea Rift: Determining spreading processes. Geomorphology, 274, 162–179.