Automated generation of additional contours to enhance contoured relief representation
Timofey Samsonov, Dmitry Walther, Sergey Koshel | Lomonosov Moscow State University, Faculty of Geography, Russia
Keywords: contours, algorithms, relief representation
Relief representation by contours follows the height levels selected manually or using the automated classification of elevation data. However, it is impossible to capture all terrain features by a fixed number of height levels. Many surface forms are hidden between contours. There are geomorphological zones that are subject to high probability of such cases. The situation is typical for the foot of the mountains, where the steep slopes are adjacent to the flat planes. Topographic maps use arithmetic progression of height levels, which cannot represent both regions equally vividly without clutter or emptiness. Another common example is the representation of a flood plain, which is characterized by numerous subtle features between main contours. The solution to the problem is to use additional contours. Additional contours are usually depicted by dashed lines and are drawn in areas of large distances between standard contours at the intermediate height. Additional contours are the essential element of terrain depiction used by national mapping agencies on the entire mapping scale series. Despite the relevance and expressive power of this graphical technique, no algorithms for automated construction of additional contours have been developed to date, which determines the motivation of this study.
We have developed automated approach to generation of additional contours to enhance the representation of relief where the distances between main contours are excessively large.
The whole algorithm can be divided into several stages. At the first stage, the main contours are constructed with a given (constant or variable) height progression. Then an auxiliary raster surface is constructed, in each cell of which the approximate distance between the main contours is estimated. This is the trickiest part of the workflow, since the width of a zone between lines could be estimated in numerous ways. We have implemented and tested the following options for solving this task:
- Using Euclidean distance from pixel to the nearest contour;
- Using the sum of Euclidean distances from pixel to the nearest two contours;
- Using the Delaunay triangulation of contours (triangle altitude is used as an approximation of zone width, all pixels inside triangle have the same width value then);
- Using the slope angle at the pixel;
- Using the maximum between 2 and 3.
Experimental work shows that the best and the most stable way to estimate the local width of a zone is the second case, in which the sum of the distances to the nearest two contour lines is calculated.
After the width surface is constructed, intermediate contours series are derived between the main contours (height progression is shifted by the half of the height step). Each node of the additional contour is enriched with a local zone width value interpolated from the width surface. By setting the threshold width, one then can filter the nodes of additional contours, leaving only those that are located in areas of significant width (exceeding a specified threshold value). Initially this was the last stage of the processing workflow, since it is possible to reconstruct the additional contours from the points left after filtering.
However, natural variation in the width of the zone often leads to generation of short gaps between segments of one additional contour, or generation of excessively short segments. In order to eliminate such artifacts, the processing workflow includes additional tolerances for the minimum allowable gap between segments of one additional contour line and the minimum allowable length of the segment itself. Therefore, after filtering the nodes, short spaces are first filled (their points are returned to additional contours), which leads to an increase in the length of the additional contour segments. After that, the segments which are still shorter than the defined tolerance, are excluded from the resulting set of additional contours.
An example image obtained using the developed approach is shown in Figure 1. Main contours are represented on the left side of the figure (a), while the right side demonstrates the same image with empty areas filled by additional contours. The image becomes more informative and reveals many additional terrain features without overcrowding the representation.
The developed processing approach is simple and allows the automated generation of additional contours. However, obtaining the high-quality result requires experimental work on the selection of the parameters of the algorithm (the minimum width of the zone, the length of the segment and the length of the gap), taking into account the morphological features of the relief and the selected height progression of the main contours. The result of such experimental work on various terrains can be used to derive the optimal automatic parameterization of the algorithm, which is the subject of ongoing research.
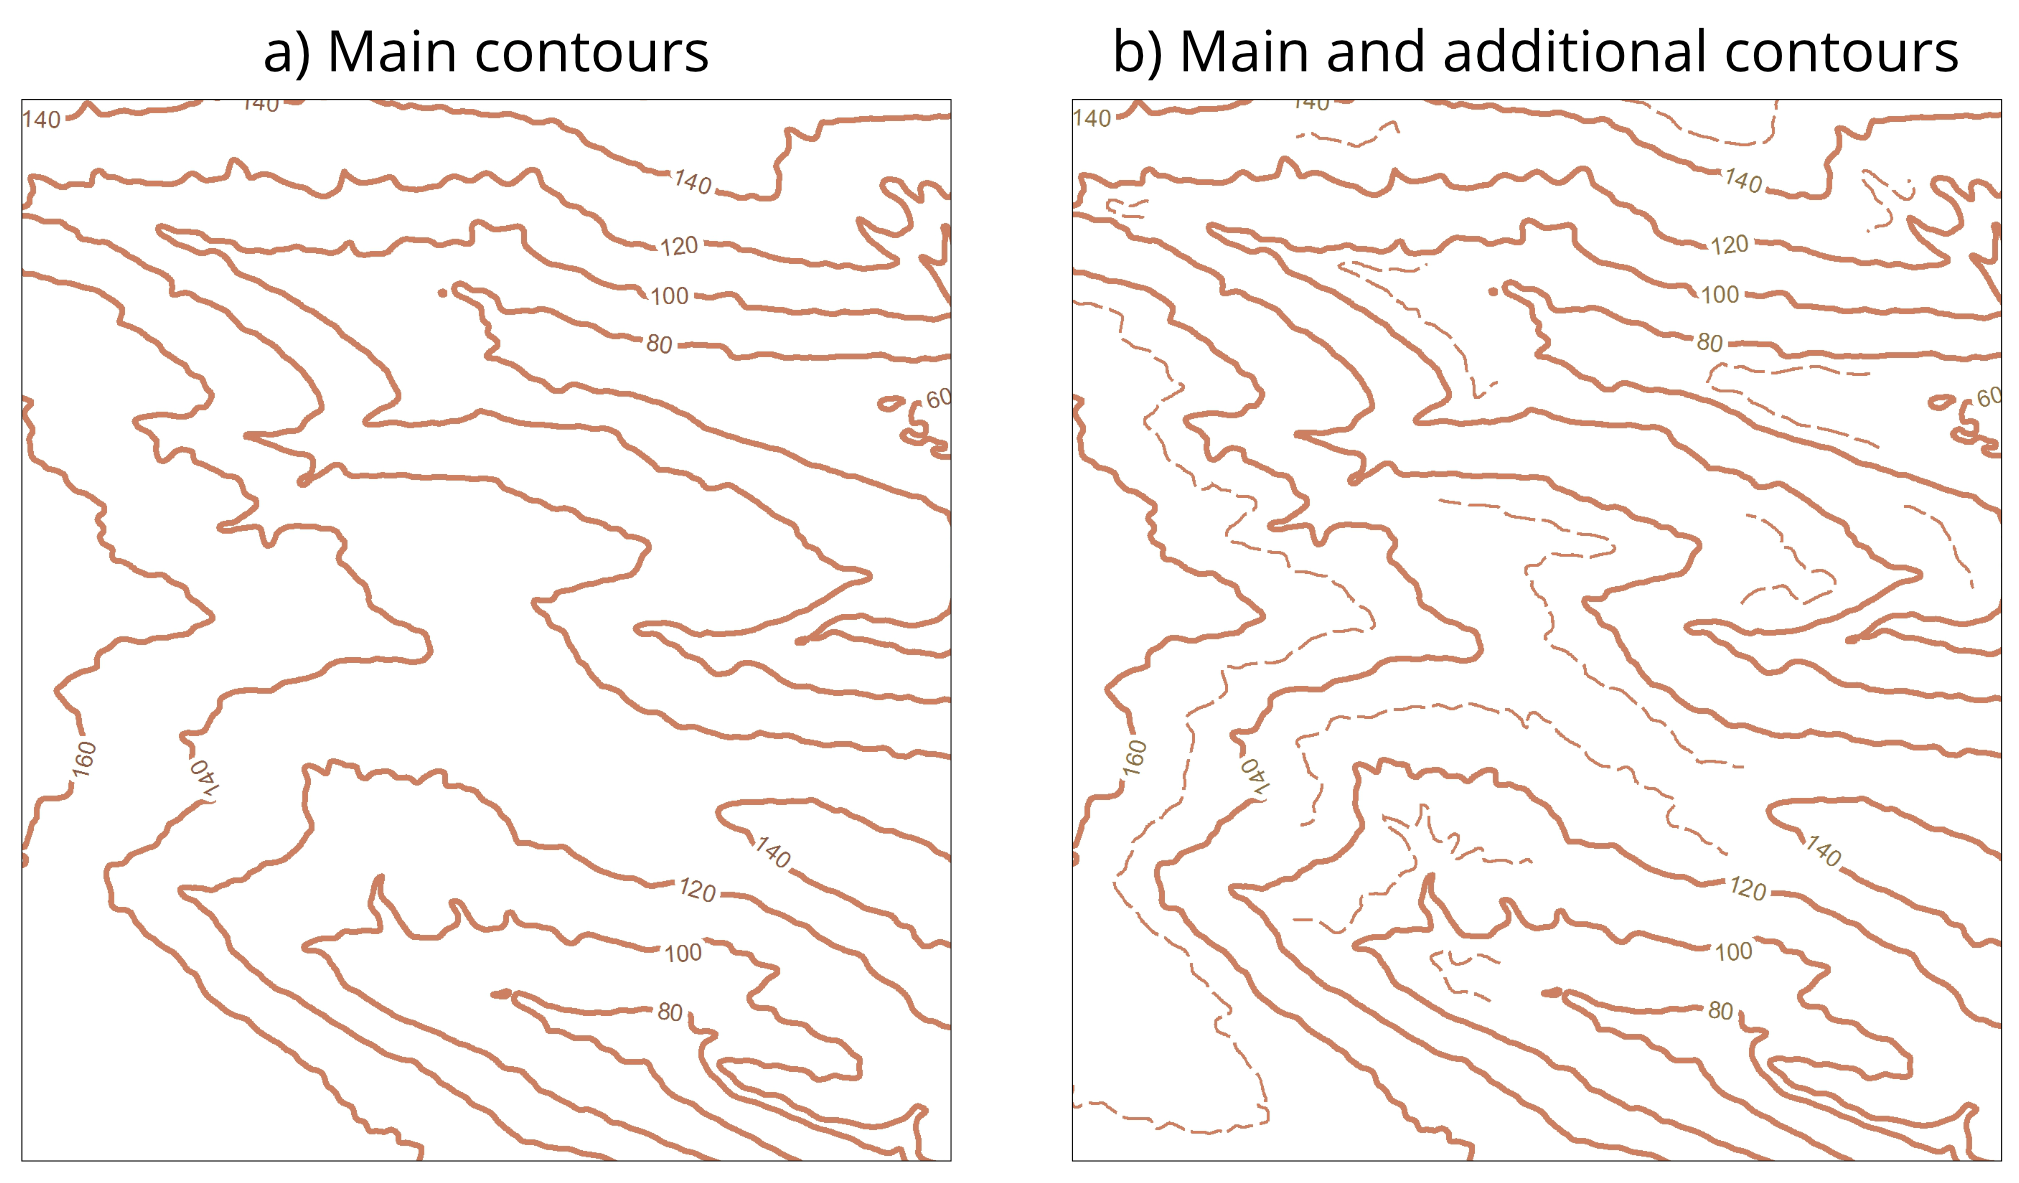
Figure 1. Enhancing contour relief representation by additional contours